

How to Make an App Like Weather Radar
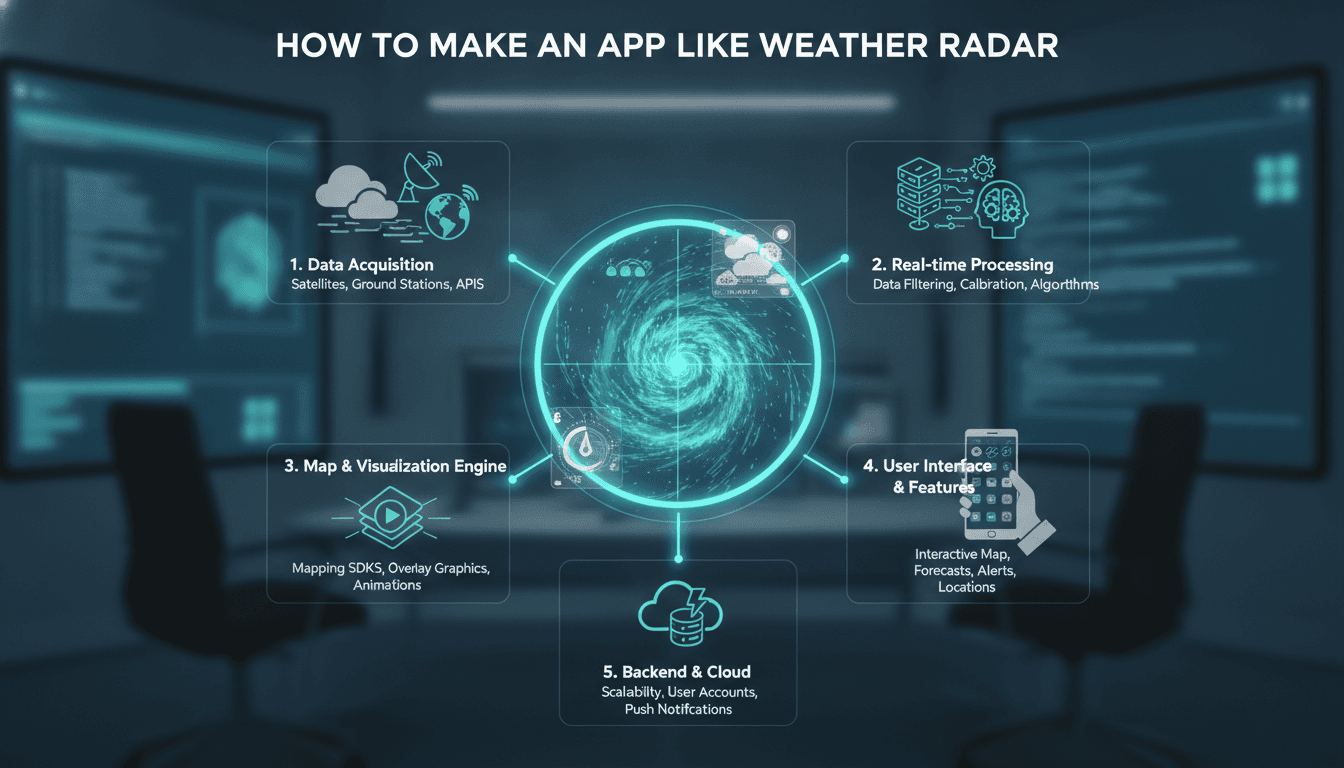
Building a weather radar app is a genuinely interesting engineering problem. You're dealing with real-time geospatial data, multiple third-party feeds, animated tile rendering, and users who will notice immediately if something is wrong. This post walks through the architecture decisions that actually matter.
What Does a Weather Radar App Actually Do Under the Hood?
Most people think of weather radar apps as data display tools. They're not. They're real-time geospatial pipelines with a thin UI on top.
The core loop looks like this: ingest radar data from a source, process and tile it, cache aggressively, serve it to a map renderer, and animate it. Each step has its own failure modes and latency budget.
Data Sources
You have three realistic options for radar data:
| Source | Coverage | Latency | Cost |
|---|---|---|---|
| NOAA NEXRAD (USA) | US only | 5–10 min | Free |
| Copernicus/EUMETSAT | Europe | 15 min | Free (registration required) |
| Tomorrow.io / OpenWeatherMap APIs | Global | 5–15 min | Paid, per-call |
| RainViewer API | Global composite | ~5 min | Free tier + paid |
For global coverage without building your own ingestion pipeline, RainViewer is the fastest path to a working prototype. For production apps where you want raw data control, NEXRAD or EUMETSAT feeds give you more to work with.
Radar Tiles vs. Vector Data
Radar imagery comes in two forms. Raster tiles are pre-rendered PNGs or WebP images you overlay on a map. Vector data is the raw reflectivity values (in dBZ) that you render yourself.
Raster tiles are simpler. You get a URL pattern like https://tilecache.rainviewer.com/v2/radar/{timestamp}/{size}/{z}/{x}/{y}/4/1_1.png and drop it into a Mapbox or Leaflet tile layer. Done in an afternoon.
Vector/raw data is harder but gives you full control over colour scales, thresholds, and animation frame timing. Worth it if your app needs to distinguish light rain from heavy precipitation accurately, or if you're building on top of the data (e.g. routing avoidance, field alerts).
How Do You Handle Real-Time Updates Without Killing Your Backend?
This is where most teams get it wrong on the first pass. Polling every client directly from a weather API at 60-second intervals does not scale. At 50,000 active users, you're generating 50,000 requests per minute to a rate-limited external API.
The right pattern is a server-side fetch-and-cache layer.
Your backend (a simple Node.js or Go service works fine) polls the radar source once per update interval, stores the result in Redis with a TTL matching the source's update frequency, and serves all clients from cache. Clients poll your endpoint, not the upstream source.
For the push side, WebSockets or Server-Sent Events (SSE) let you notify clients when new radar frames are available rather than having them poll blindly. SSE is simpler to implement and sufficient for this use case since radar updates are one-directional.
A typical architecture:
- Cron job or scheduled Lambda hits upstream API every 5 minutes
- Stores tile URLs and metadata in Redis (TTL: 10 minutes)
- Pushes an event to a pub/sub channel (Redis pub/sub or AWS SNS)
- SSE server broadcasts the new frame list to subscribed clients
- Clients fetch new tiles from your CDN-backed tile proxy
The tile proxy is important. You cache upstream radar tiles at the CDN edge (CloudFront, Cloudflare) so you're not re-fetching the same tile for every user in the same region.
/// Not sure where to start?
Get the architecture before you commit
Tell us what you're building and we'll map the technical approach, stack, and rough timeline. No cost, no obligation, no sales call required.
Building the Map Renderer and Animation Layer
Map rendering for weather radar typically uses Mapbox GL JS (v2/v3), Leaflet, or Deck.gl depending on what else your app needs.
For a pure radar overlay on a standard map, Leaflet with the L.TileLayer class is the simplest path. You create one tile layer per time frame and toggle visibility to animate.
Mapbox GL JS gives you smoother interpolation and better mobile performance because rendering happens on the GPU via WebGL. If your app includes vector street data, 3D terrain, or custom styling, Mapbox is worth the cost.
Deck.gl (from Uber, now open source) is the right choice if you're building data-heavy visualisations on top of radar: lightning strike overlays, flight path avoidance, agricultural yield correlations. It handles millions of data points via WebGL without frame drops.
Animation Timing
Radar animation is typically 10–15 frames covering the past 90 minutes, played at 200–600ms per frame. The last frame usually holds for 1–2 seconds before looping.
One common mistake: loading all frames before starting animation. Load the first 3 frames, start playing, and prefetch the rest in the background. Users perceive the app as faster even if total load time is the same.
Preloading tile images via the browser's Image() API before adding them to the map layer eliminates the flicker between frames that users complain about.
What Infrastructure Do You Need for a Production Deployment?
A hobby project and a production app with 100,000 daily active users need meaningfully different infrastructure.
For production, the minimum viable stack looks like:
- Tile proxy and cache: Nginx or Caddy in front of your origin, Cloudflare or CloudFront for edge caching. Set
Cache-Control: max-age=300on radar tiles (5-minute update cadence). - Backend API: Stateless service behind a load balancer. Auto-scaling group or container cluster (ECS/GKE). Weather data processing is CPU-light so instances can be small.
- Real-time layer: Redis pub/sub for internal events, SSE or WebSockets for client connections. A single Redis instance handles tens of thousands of pub/sub subscribers easily.
- Monitoring: Radar data staleness is a silent failure mode. Alert if your cached data is more than 15 minutes old. Users won't tell you; they'll just uninstall.
Mobile apps (iOS and Android) use the same tile URLs but need to handle background refresh differently. On iOS, BGAppRefreshTask lets you prefetch the latest frames so the animation is ready when the user opens the app. On Android, WorkManager handles the equivalent.
Handling Edge Cases That Actually Break Apps
A few failure modes that are worth knowing about before you hit them.
Sparse radar coverage. NEXRAD has gaps in mountainous terrain and coastal areas. Your UI needs to communicate coverage boundaries clearly rather than showing an empty map that looks like a bug.
Composite vs. single-station data. Many APIs return composites blended from multiple radar stations. Reflectivity values from composites are less accurate for precise precipitation estimation. If your app feeds into anything decision-critical (agriculture, aviation, construction scheduling), document this limitation explicitly.
Timezone and timestamp handling. Radar timestamps are in UTC. Users are not. Get this wrong and your "past 90 minutes" animation shows the wrong window. Use a library like date-fns-tz or Luxon and keep all internal timestamps in UTC until the display layer.
API rate limits during severe weather. Ironically, the times when users most want real-time radar data are exactly when upstream APIs are under the most load. Build retry logic with exponential backoff and serve stale-but-labelled cache data rather than erroring out.
Conclusion
The core of a weather radar app is straightforward once you separate the concerns: data ingestion, caching, tile serving, and map rendering. The complexity lives in the edge cases: coverage gaps, timestamp handling, animation UX, and scaling the cache layer.
If you're evaluating whether to build this in-house or integrate a third-party SDK, the honest answer is that the map rendering layer is commodity now. What differentiates weather apps is data freshness, coverage quality, and how well the UI communicates uncertainty. That's where the build time is worth spending.
If you're starting a build and want a second opinion on your architecture before you commit to infrastructure, reach out to the team at Sodio.
FAQ
How often does weather radar data update? Most public radar sources update every 5 to 10 minutes. NEXRAD Level III products update every 5 minutes. Composite global APIs like RainViewer also target 5-minute refresh cycles, though actual latency varies by region. Plan your caching TTL to match the source's update cadence, not shorter.
What's the difference between reflectivity and precipitation rate in radar data? Reflectivity (measured in dBZ) is what radar actually measures: how much microwave energy bounces back from precipitation. Precipitation rate (mm/hr) is derived from reflectivity using empirical equations like the Marshall-Palmer Z-R relationship. The conversion introduces uncertainty, especially for snow or hail, so treat derived precipitation values as estimates.
Can I build a weather radar app without paying for a data API? Yes, for certain regions. NEXRAD data (USA) and EUMETSAT data (Europe) are freely available. RainViewer offers a free tier. The trade-off is engineering effort: free sources require you to handle raw data formats (NetCDF, HDF5, GRIB2), coordinate projection, and compositing yourself. Paid APIs abstract all of that.
How do I show radar data on a mobile app? Use a map SDK that supports raster tile overlays. Mapbox Maps SDK for iOS and Android both support this natively. You pass the tile URL template and the SDK handles tile fetching, caching, and rendering. The animation loop is your responsibility: cycle through time-stamped tile layers at your chosen frame rate.
What causes the flickering between radar animation frames?
Flickering happens when a tile isn't fully loaded before the animation advances to that frame. Fix it by preloading all tile images for each frame before starting playback. In a browser, create Image objects for each tile URL and wait for their onload events. On mobile, use the SDK's tile preloading or prefetch API if available.
Have a project in mind? Contact Sodio Technologies to discuss your requirements and explore the right technology solution for your business.
/// Work with us
Talk to the engineers who'd build it
You'll get a technical scope, timeline and cost estimate from the people doing the work, not an account manager. In-house team, no subcontracting, since 2016.