

How to Make an App Like Moovit
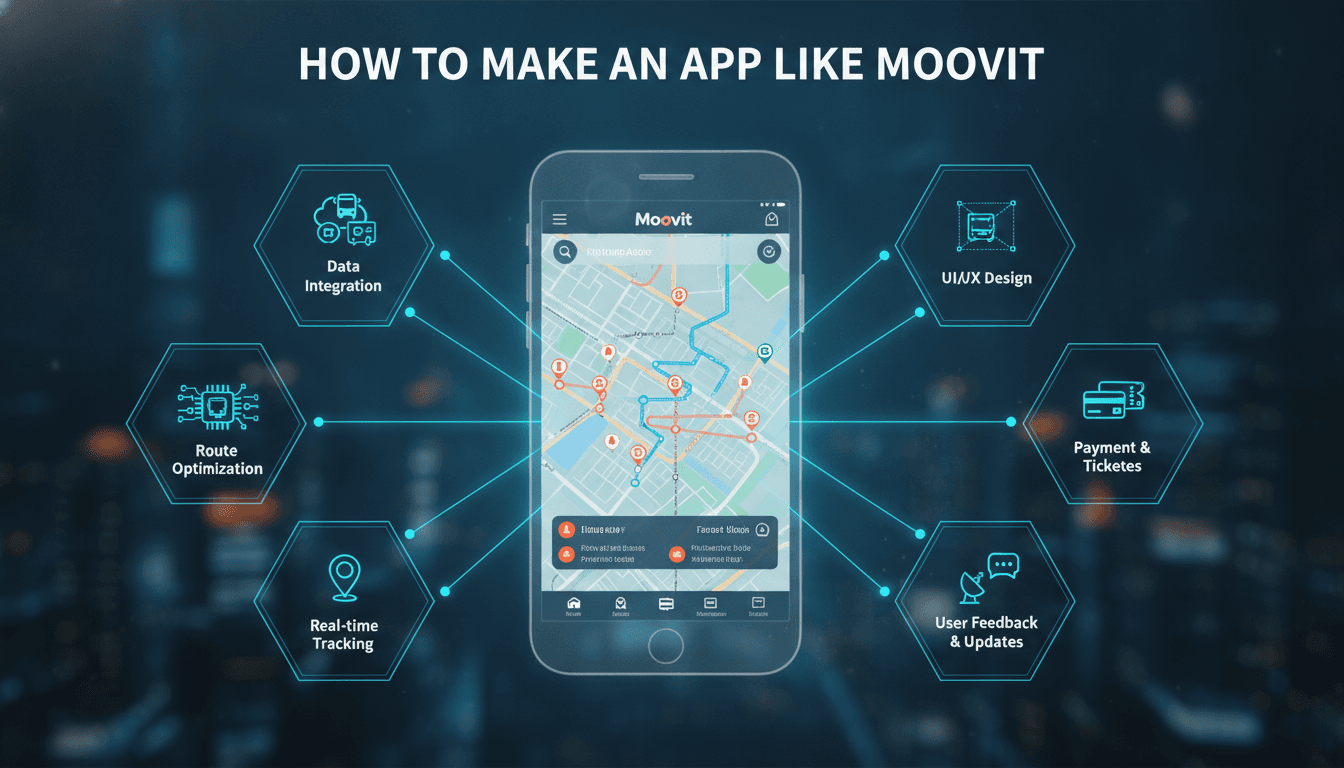
Public transit is messy. Schedules change, buses run late, metro lines close for maintenance, and riders are left guessing. Moovit solved that guessing game for more than 1.7 billion users across 3,400+ cities by turning fragmented transit data into a single, readable journey plan. If you're planning to build something similar, this guide walks through what it actually takes — the features, the data, the architecture, the costs, and the pitfalls.
What Moovit Actually Does
Before writing a line of code, it helps to be precise about the product. Moovit is not just a map. It's a multimodal trip planner that combines:
- Scheduled public transit (bus, metro, tram, ferry, rail)
- Real-time vehicle positions and arrival predictions
- Walking directions to and from stops
- Micromobility options (bike share, scooters, ride-hailing)
- Crowdsourced service reports from riders
- Live navigation with "get off here" alerts
The magic isn't any single feature. It's the stitching — turning a dozen disconnected transport operators into one coherent answer to "how do I get from A to B right now?"
We cover a closely related subject in How to Make an App Like Yahoo Weather.
Step 1: Pick Your Niche and Launch City
The single biggest mistake teams make is trying to launch globally. Moovit took years and a large crowdsourcing community to reach its coverage. You cannot match that on day one.
For a closer look at a related topic, read our guide on How to Make an App Like RideAmigos.
Better approaches:
| Strategy | Why It Works |
|---|---|
| Single-city depth | Own one metro area with better data than anyone |
| Underserved regions | Tier-2/3 cities where Google Maps transit is thin |
| Vertical focus | Campus shuttles, corporate transport, airport transfers |
| Operator white-label | Build for a transit authority that already owns the data |
Pick a city where transit data is available (or obtainable), the ridership is high, and existing apps are weak.
Step 2: Solve the Data Problem First
This is the part that kills most transit apps. Your app is only as good as your data.
Static Schedule Data (GTFS)
GTFS (General Transit Feed Specification) is the industry standard. A GTFS feed is a zip of CSV files describing:
agency.txt— the operatorroutes.txt— bus/train linestrips.txt— individual runs of a routestop_times.txt— arrival/departure at each stopstops.txt— geocoded stop locationsshapes.txt— the drawn path on the mapcalendar.txt— which days a service runs
Sources include Mobility Database, Transitland, OpenMobilityData, and direct downloads from transit agency developer portals.
Real-Time Data (GTFS-RT)
GTFS-Realtime is a Protocol Buffers feed with three message types:
- TripUpdates — delays and predicted arrival times
- VehiclePositions — live GPS of each vehicle
- ServiceAlerts — disruptions, detours, closures
Not every agency publishes GTFS-RT. Some offer SIRI, some offer proprietary APIs, and some offer nothing at all.
When There Is No Data
For cities with informal transit (matatus, jeepneys, minibuses), you may need to create the data. Moovit built a community of "Mooviters" who mapped routes manually. Options:
- Crowdsource route mapping with in-app tools
- Hire local surveyors to ride and record routes
- Infer routes from anonymized rider GPS traces
- Partner directly with operators
Budget real time and money for this. Data acquisition is often 30–40% of the total effort.
Step 3: Core Feature Set
MVP Features
Journey Planning Enter origin and destination, get ranked route options with departure times, transfers, walking segments, and total duration.
Live Arrivals Show the next departures at a given stop, ideally with real-time countdowns and confidence indicators.
Nearby Stops Auto-detect location and surface everything within walking distance.
Line Browser Let users explore a route end to end, see all stops, and check timetables.
Service Alerts Push notifications for disruptions on saved lines.
Favorites and Saved Places Home, work, frequent stops — one-tap access.
Phase Two Features
- Live navigation with vibration alerts before your stop
- Multimodal blending (walk + scooter + train + bus)
- Offline mode with cached schedules and maps
- Crowding indicators based on rider reports or operator data
- Accessibility routing for step-free journeys
- Fare calculation and integrated ticketing
- Carbon savings tracker
- Trip history and commute insights
Step 4: The Routing Engine
This is your technical core. You have two paths.
Use an Existing Engine
| Engine | Notes |
|---|---|
| OpenTripPlanner (OTP2) | Java, mature, supports GTFS + OSM, RAPTOR-based |
| Valhalla | C++, great for multimodal and offline tiles |
| Navitia | Python/C++, used by several European operators |
| MOTIS | Fast, modern, strong RAPTOR implementation |
| GraphHopper | Good routing, transit support via extension |
For most teams, OpenTripPlanner 2 is the pragmatic choice. It's battle-tested, handles GTFS-RT updates, and has a GraphQL API.
Build Your Own
Only do this if you have a genuine reason. If you do, the algorithms to know are:
- RAPTOR — Round-bAsed Public Transit Optimized Router; fast, no graph needed
- CSA — Connection Scan Algorithm; simple and very fast for dense timetables
- Transfer Patterns — precomputed patterns for sub-millisecond queries at scale
- Multi-criteria Pareto search — optimize time, transfers, walking distance, and cost simultaneously
Plain Dijkstra or A* on a time-expanded graph will not scale to a large city with real-time updates.
Step 5: Architecture
Suggested Stack
Mobile Clients
- Flutter or React Native for cross-platform speed
- Native Swift/Kotlin if you need deep background location and battery optimization
Maps and Rendering
- Mapbox or MapLibre GL for vector tiles and custom styling
- Google Maps SDK if you want familiarity over customization
- OpenStreetMap data for walking network and geocoding
Backend
- Node.js/NestJS or Go for API gateway
- Java (OTP) or C++ for the routing service
- Python for data pipelines and ML predictions
Data Layer
- PostgreSQL + PostGIS for spatial queries and stop data
- Redis for real-time vehicle positions and prediction caching
- ClickHouse or BigQuery for analytics and historical delay data
- S3/GCS for GTFS archives and map tiles
Infrastructure
- Kubernetes for the routing fleet (routing is CPU-heavy and bursty)
- Kafka or Pub/Sub for the real-time ingestion pipeline
- CDN for tiles and static schedule bundles
The Real-Time Pipeline
Agency GTFS-RT feeds
        ↓
  Poller / Ingest workers (every 15–30s)
        ↓
  Normalizer (map to internal IDs, validate)
        ↓
  Kafka topic: vehicle.positions / trip.updates
        ↓
  ┌─────────────┬──────────────┬─────────────┐
  Redis cache   Prediction ML   Historical store
  (live reads)  (ETA refine)    (analytics)
        ↓
  API layer → WebSocket / polling → App
Poll intervals matter. Too frequent and you get rate-limited; too slow and your predictions go stale. 15–30 seconds is typical.
Better ETAs with Machine Learning
Raw GTFS-RT predictions are often naive. You can beat them by training on your own historical data using features like:
- Time of day and day of week
- Historical dwell time at each stop
- Current traffic conditions
- Weather
- Upstream delay propagation
- Vehicle type and driver patterns
Gradient boosting models (XGBoost, LightGBM) work well here and are cheap to serve. A 20% improvement in arrival accuracy is genuinely felt by users.
Step 6: UX That Actually Works on a Platform
Transit apps are used one-handed, in a hurry, in bad light, with poor signal. Design accordingly.
Principles worth following:
- Answer first, details second. The screen should open with "Next 47 in 3 min."
- Big tap targets. People are walking.
- Color-code by line, not by your brand. Riders think in line colors.
- Show confidence. Distinguish "scheduled" from "live" clearly.
- Design for offline. Underground stations have no signal. Cache aggressively.
- Minimize input. Predict destinations from time of day and history.
- Accessibility is not optional. Screen reader labels, high contrast, step-free filters.
The best transit apps feel like a glance, not a session.
Step 7: Monetization
| Model | Description | Viability |
|---|---|---|
| Advertising | Location-aware ads, sponsored placements | Proven at scale, needs volume |
| Premium subscription | Ad-free, offline maps, advanced alerts | Modest but steady |
| Data licensing | Anonymized OD matrices to cities and planners | High margin, this is Moovit's real business |
| B2B SaaS | White-label apps for transit authorities | Strong for early revenue |
| Ticketing commission | Cut of fares sold in-app | Requires operator partnerships |
| MaaS partnerships | Referral fees from ride-hail and micromobility | Easy to bolt on |
Note that Moovit was acquired by Intel for roughly $900M largely because of its data, not its ad revenue. The mobility intelligence layer is where the value concentrates.
Step 8: Cost and Timeline
Rough estimates for a competent build, single city, iOS + Android + backend:
| Phase | Duration | Ballpark Cost |
|---|---|---|
| Discovery, data audit, UX | 4–6 weeks | $15k–$30k |
| MVP (planner, live arrivals, alerts) | 4–6 months | $60k–$140k |
| Real-time pipeline + ML ETAs | 2–3 months | $40k–$80k |
| Multimodal + ticketing | 3–4 months | $50k–$100k |
| Multi-city expansion | Ongoing | $10k–$25k per city |
Ongoing infrastructure for a mid-sized city typically runs $2k–$8k/month, scaling with routing query volume and map tile usage.
Common Pitfalls
Underestimating data ops. Feeds break. Agencies change stop IDs without warning. You need monitoring, validation, and someone whose job is data health.
Ignoring battery drain. Continuous location tracking during live navigation will destroy a phone's battery if done naively. Use significant-change location APIs, geofences, and adaptive polling.
Trusting real-time blindly. Some agency feeds are worse than the printed schedule. Measure feed accuracy per operator and fall back when confidence is low.
Launching too wide. Ten cities with mediocre data lose to one city with excellent data.
Skipping the walking network. A route that says "transfer in 2 minutes" is useless if the transfer requires a 6-minute walk between platforms. Model pedestrian paths properly with OSM.
No feedback loop. Let users report wrong times, missing stops, and cancelled service. It's free data and it builds community.
Compliance and Legal
- Check the license on every GTFS feed — some prohibit commercial use
- Location data triggers GDPR and CCPA obligations; minimize, anonymize, and be explicit in consent flows
- Accessibility regulations (ADA, EN 301 549) may apply, especially for government-adjacent products
- Map data licensing: OSM requires attribution under ODbL; commercial tile providers have their own terms
- If you handle ticketing, you're now in payments — PCI DSS scope
A Realistic Roadmap
Months 0–2: Data audit, city selection, agency conversations, UX prototype Months 2–6: MVP with static routing, live arrivals, one city, closed beta Months 6–9: Real-time pipeline, ML predictions, public launch Months 9–14: Multimodal integrations, offline mode, second and third cities Months 14+: Ticketing, B2B dashboard, data licensing conversations
Final Thoughts
Building an app like Moovit is less a mapping problem and more a data logistics problem. The routing algorithms are solved and open source. The map rendering is a commodity. What separates a great transit app from a dead one is whether the data is accurate, fresh, and complete — and whether you've earned the trust of riders who need to catch a bus in four minutes.
Start narrow. Get one city genuinely right. Build the data operations muscle early. The expansion becomes mechanical once the machine works.
Have a project in mind? Contact Sodio Technologies to discuss your requirements and explore the right technology solution for your business.
/// Work with us
Talk to the engineers who'd build it
You'll get a technical scope, timeline and cost estimate from the people doing the work, not an account manager. In-house team, no subcontracting, since 2016.