

How to Optimize React.js Applications for Performance
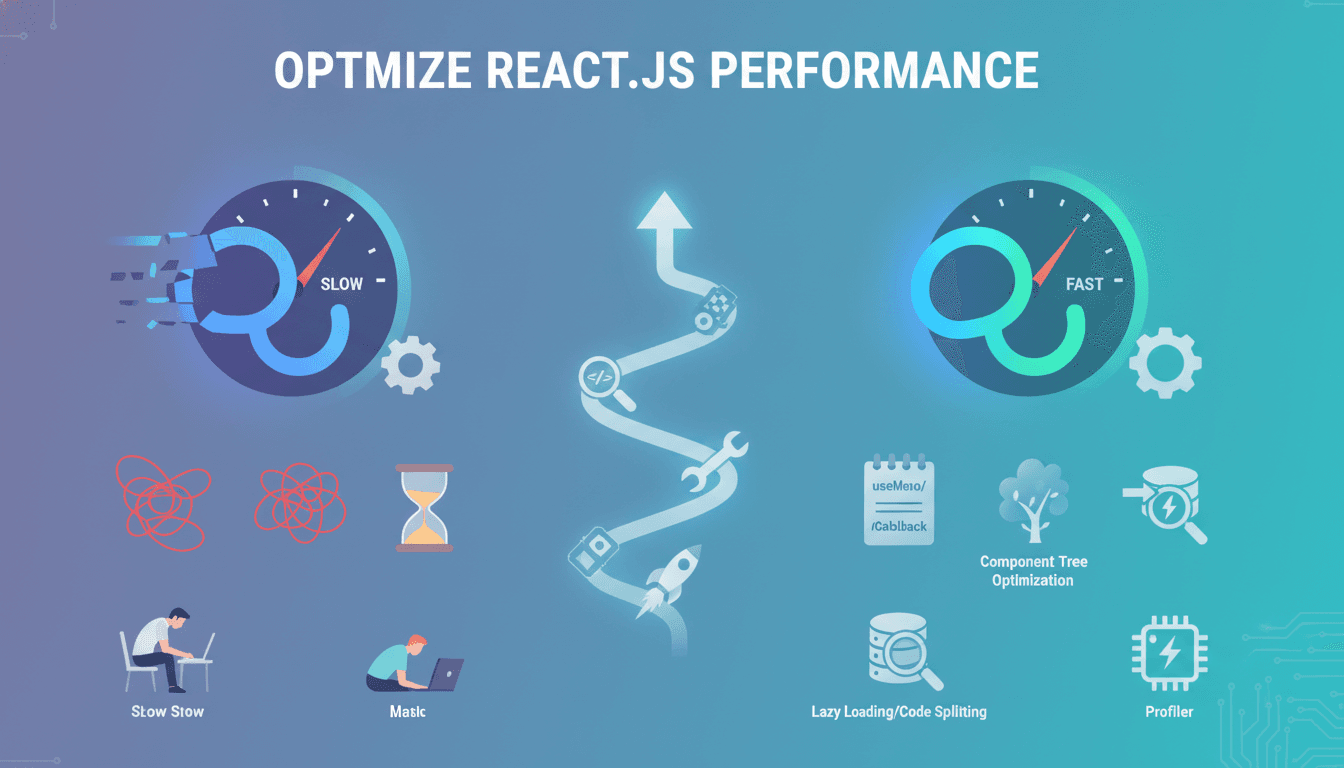
React applications have a habit of starting fast and growing slow. A small team ships a clean MVP, the codebase doubles, and suddenly the bundle is 2 MB, time-to-interactive is over five seconds on a mid-range Android device, and the profiler shows components re-rendering on every keystroke. This post covers the patterns that actually move the needle, why they work, and where they can go wrong.
Where Does React Performance Actually Break Down?
Before reaching for tools, it helps to understand the two distinct failure modes.
The first is render thrashing: components re-render more often than they need to. React's reconciler is fast, but it is not free. Every re-render runs your component function, diffs the output against the previous virtual DOM, and may schedule DOM mutations. When a parent re-renders and its children have no memoisation, every child runs again, even if its props did not change.
The second is bundle and load cost: the browser has to download, parse, and execute your JavaScript before the user sees anything useful. A 1 MB compressed bundle takes roughly 3–4 seconds to parse on a median mobile device, according to data published by the Chrome team. That is before a single fetch has been made.
Both problems are real, but they need different fixes. Conflating them leads to applying memoisation to code that the user hasn't even loaded yet, or code-splitting a bundle that's already tiny.
What Should You Actually Measure Before Touching Code?
Profiling before optimising is not advice, it is a prerequisite. Guessing the bottleneck correctly is rare.
React DevTools Profiler
The React DevTools Profiler (available in Chrome and Firefox as an extension) records which components rendered, why they rendered, and how long each commit took. The "why did this render?" feature, enabled in the settings panel, tells you whether a re-render was caused by a state change, a context change, or a parent re-render. That distinction matters enormously.
Lighthouse and Web Vitals
Run a Lighthouse audit in an incognito window with CPU throttling set to 4x (approximating a low-end device). Pay attention to Largest Contentful Paint (LCP), Total Blocking Time (TBT), and Cumulative Layout Shift (CLS). These are the metrics Google uses for ranking and the ones that correlate most strongly with user drop-off. A TBT above 200 ms is worth investigating.
Bundle Analysis
Use webpack-bundle-analyzer or the Vite equivalent rollup-plugin-visualizer. Run it once and you will almost always find at least one library that is imported in full when only a fraction of it is used. moment.js and lodash are the classic offenders; date-fns and targeted lodash-es imports are the standard replacements.
/// Not sure where to start?
Get the architecture before you commit
Tell us what you're building and we'll map the technical approach, stack, and rough timeline. No cost, no obligation, no sales call required.
Memoisation: When It Helps and When It Gets in the Way
React.memo, useMemo, and useCallback are the tools most teams reach for first. They are also the tools most teams misuse.
React.memo wraps a component and skips re-renders if props are shallowly equal. This works well for pure, leaf components that receive primitive props. It is counterproductive when the parent recreates object or function props on every render, because the shallow comparison always fails. Wrapping the child with React.memo without also stabilising the parent's output is wasted overhead.
useCallback stabilises a function reference between renders. Use it when a function is passed as a prop to a memoised child, or used as a dependency in a useEffect that should not run on every render. Do not wrap every function in useCallback by default; the closure over the dependency array has its own cost.
useMemo is appropriate for genuinely expensive computations: sorting or filtering large arrays, deriving complex objects, or computing values that feed into child props. For simple calculations, the memoisation overhead can exceed the calculation cost. As a rough heuristic, if the computation takes less than a millisecond, skip useMemo.
State Shape and Context
Context is a common performance trap. When a context value changes, every consumer re-renders, regardless of whether the specific data it reads has changed. The fix is to split contexts by update frequency. Put rarely-changing data (user session, feature flags) in one context and frequently-changing data (form state, UI state) in another. For global state that changes at high frequency, consider Zustand or Jotai instead of React Context; both use a subscription model that avoids the blanket re-render.
Code Splitting and Lazy Loading
React 18 ships with React.lazy and Suspense built in. The pattern is straightforward:
const HeavyChart = React.lazy(() => import('./HeavyChart'));

function Dashboard() {
  return (
    <Suspense fallback={<Spinner />}>
      <HeavyChart />
    </Suspense>
  );
}
This splits HeavyChart and its dependencies into a separate chunk, loaded only when the component is first rendered. For route-level splitting, wrapping each route's component in React.lazy is the minimum effective approach. Most applications can cut their initial bundle by 30–50% this way without any change to functionality.
Route-level splitting is the low-hanging fruit. After that, look at:
- Modal and drawer content: heavy forms or editors that most users never open
- Third-party widgets: chat widgets, analytics dashboards, video players
- Admin or settings panels: rarely visited but often large
One trade-off worth naming: code splitting increases the number of network requests. On HTTP/2 this is largely fine. On HTTP/1.1, or in environments with high network latency, aggressive splitting can slow things down. Measure after splitting, not just before.
Virtualisation for Long Lists
Rendering 10,000 list items into the DOM is slow regardless of how well the rest of your application is optimised. The DOM simply cannot handle that many nodes efficiently.
Virtualisation renders only the items currently in the viewport, plus a small overscan buffer. react-window is the standard library for this; it is lighter than react-virtualized and covers most use cases. For complex scenarios like variable-height rows or infinite scroll combined with sorting, @tanstack/virtual (TanStack Virtual v3) gives more control.
The practical threshold: if a list exceeds around 100 items and is rendered all at once, virtualisation is worth implementing. Below that, the overhead of the virtualisation library usually exceeds the gain.
Conclusion
Performance work in React follows a consistent pattern: measure, identify the specific failure mode, apply the appropriate fix, and measure again. Memoisation does not help a slow bundle. Code splitting does not help a component that re-renders 40 times per second. The tools are well understood; the discipline is in using the right one for the right problem.
If you are starting a performance audit today, open the React DevTools Profiler first. Record a realistic user interaction, find the components with the longest render times, and check why they rendered. That single step will tell you whether you are dealing with a render problem or a load problem, and everything else follows from there.
FAQ
Does React 18's concurrent mode automatically fix performance issues?
Concurrent mode changes how React schedules work, not how much work your application generates. It can make the UI feel more responsive by interrupting non-urgent renders, but it will not fix unnecessary re-renders or large bundles. You still need to profile and optimise explicitly.
When should I use a state management library instead of React Context?
When the same piece of state is read by many components and updates frequently, Context causes unnecessary re-renders across the tree. Libraries like Zustand use a selector-based subscription model, so a component only re-renders when the specific slice of state it reads changes. Frequent, granular updates are the signal to move away from Context.
Is server-side rendering (SSR) a performance optimisation?
SSR improves perceived load time and LCP by sending pre-rendered HTML to the browser, but it does not reduce the amount of JavaScript that must execute. Time-to-interactive can still be poor if the bundle is large. SSR and client-side performance optimisation are complementary, not alternatives.
How much does tree shaking help in practice?
Significantly, if your dependencies support it. Switching from import _ from 'lodash' to named imports from lodash-es can reduce the lodash contribution to a bundle from over 500 KB to under 10 KB for typical usage. The prerequisite is that your bundler (Webpack 5, Vite, Rollup) has tree shaking enabled, which is the default in production builds.
Should I use React.memo on every component?
No. React.memo adds a shallow comparison on every render of the parent. For cheap components, that comparison costs more than just re-rendering. Apply it selectively: leaf components with stable, primitive props that sit inside frequently re-rendering parents are the right candidates. Profile first to confirm the re-render is actually a problem.
Have a project in mind? Contact Sodio Technologies to discuss your requirements and explore the right technology solution for your business.
/// Work with us
Talk to the engineers who'd build it
You'll get a technical scope, timeline and cost estimate from the people doing the work, not an account manager. In-house team, no subcontracting, since 2016.