

Precision Agriculture: Leveraging Technology for Better Yields
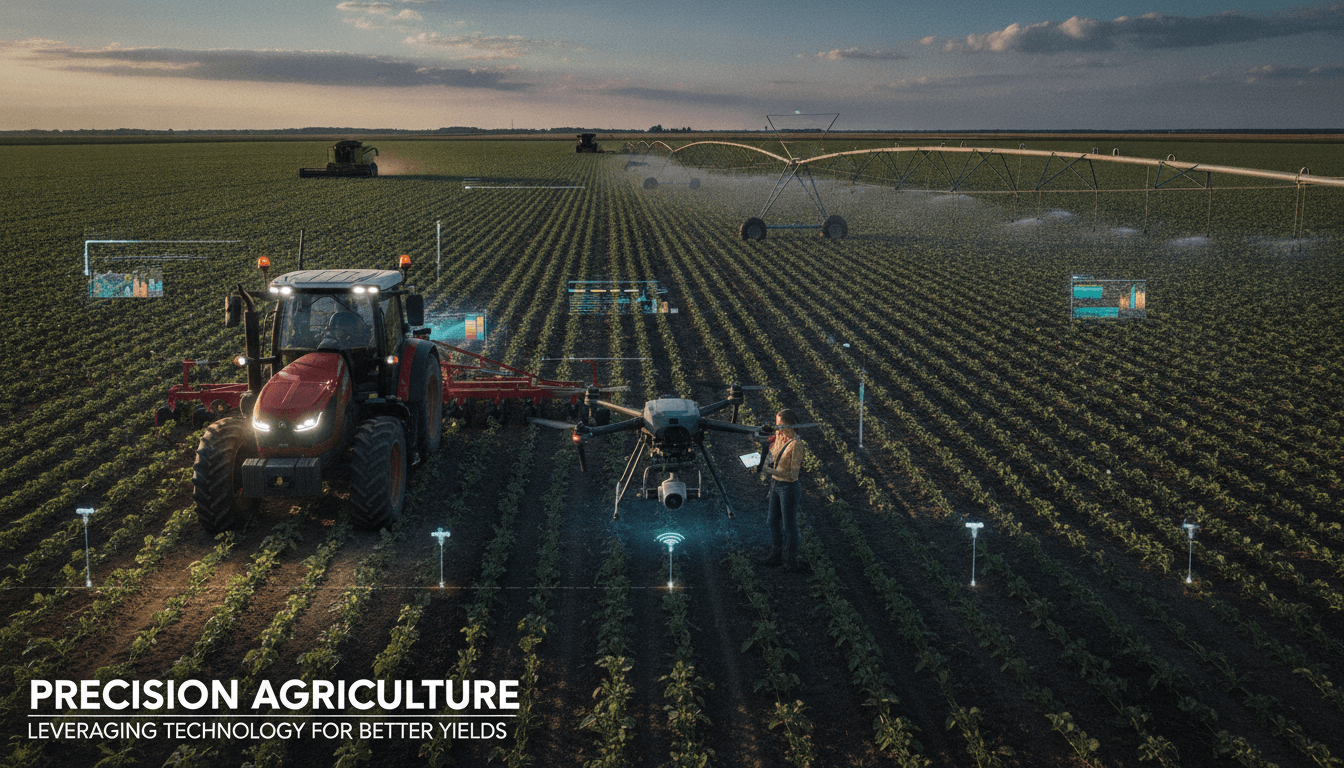
From soil sensors to satellite imagery, modern farms generate more data than most enterprise software stacks. The question is whether that data actually changes what a farmer does on Tuesday morning, or whether it sits in a dashboard nobody checks.
This post covers the core technical components of a precision agriculture system, where the hard engineering problems actually are, and what trade-offs you should think through before committing to a stack.
What Does a Precision Agriculture System Actually Consist Of?
At its core, precision agriculture is a closed-loop system: sense, infer, act, measure. The hardware layer feeds data into a processing layer, which drives decisions in the field. Simple in theory. The complexity is in the integration.
Sensing and Data Collection
The input layer typically combines several source types:
- In-field sensors: Soil moisture, temperature, EC (electrical conductivity), and pH sensors placed at variable depths. Low-power LoRaWAN nodes are the standard choice here, with gateway coverage up to 15 km in open terrain.
- Satellite and aerial imagery: Multispectral imagery from satellites like Sentinel-2 (10 m resolution, 5-day revisit) or commercial options like Planet (3 m, daily). Drone-mounted sensors give you sub-centimetre resolution on demand but cost more per hectare to operate.
- Weather stations and forecast APIs: On-farm weather stations for micro-climate data, combined with NWP (numerical weather prediction) feeds from providers like Tomorrow.io or the ECMWF open API.
- Machinery telemetry: CAN bus data from tractors and harvesters, including GPS tracks, engine load, and implement depth. John Deere's Operations Center API and CNH's AFS Connect both expose this programmatically.
Data from these sources rarely arrives in compatible formats or at compatible frequencies. A soil sensor might push readings every 15 minutes over MQTT. Satellite imagery arrives as GeoTIFF files on an irregular schedule. Machinery telemetry comes in ISO 11783 (ISOBUS) or proprietary formats. Your first real engineering challenge is normalisation.
Processing and Inference
Once you have normalised data, you need to produce actionable outputs. The two main inference tasks are:
Crop health monitoring: NDVI (Normalised Difference Vegetation Index) is the standard starting point. You compute it from red and near-infrared bands. NDVI alone tells you where the crop is stressed; it does not tell you why. For that, you need to layer in additional indices (NDRE for nitrogen, NDWI for water stress) and correlate with weather and soil data.
Variable rate prescriptions: This is where decisions translate to physical action. A prescription map tells the seeder, spreader, or sprayer what rate to apply at each GPS coordinate. The map is typically generated as a GeoJSON or shapefile, then loaded into the terminal on the machine. Agronomic models like DSSAT or APSIM can simulate yield outcomes at a field level given soil and weather inputs, which gives you a principled basis for rate recommendations rather than pure ML pattern-matching.
The ML layer sits on top of agronomic models, not instead of them. A gradient-boosted tree trained on historical yield and input data can catch field-specific patterns that a generic simulation misses. But if you skip the agronomic grounding, your model will overfit and fail badly in unusual seasons.
What Are the Real Integration Problems?
Data silos are the most common failure mode. Farms frequently run equipment from multiple manufacturers, use legacy farm management software, and have connectivity measured in kilobits rather than megabits.
Connectivity: A field 20 km from the nearest town may have no cellular signal. Edge computing on the gateway or on the machine itself is necessary, not optional. MQTT with QoS 1 or 2 handles message persistence across intermittent connections. For imagery processing, you are generally pushing to the cloud, but that means designing for batch sync rather than real-time pipelines.
Data ownership and privacy: Farm data is commercially sensitive. Yield maps reveal competitive information. Soil data has long-term asset value. Any platform you build or buy must be explicit about who owns the data, where it is stored, and whether it is used to train shared models. This is increasingly regulated: the EU's Data Act (2025) has direct implications for connected machinery data.
Interoperability standards: ADAPT (Agricultural Data Application Programming Toolkit) is the closest thing the industry has to a universal data model. It covers field boundaries, prescriptions, and operational data. Supporting ADAPT means you can import and export from most major FMIS platforms without bespoke parsers.
/// Not sure where to start?
Get the architecture before you commit
Tell us what you're building and we'll map the technical approach, stack, and rough timeline. No cost, no obligation, no sales call required.
How Do Variable Rate Technologies Actually Perform in the Field?
Variable rate application (VRA) is the part of precision agriculture with the clearest ROI evidence. A 2023 meta-analysis across 60 European trials found that variable rate nitrogen application reduced input use by 15% on average while maintaining yield within 2% of uniform rate treatments. The variance matters: on highly uniform fields, VRA adds cost without benefit. On fields with significant spatial variability in soil type or topography, the savings compound season over season.
The technology chain for VRA looks like this:
| Step | Technology | Key Consideration |
|---|---|---|
| Sampling / sensing | Grid sampling, EC mapping, satellite indices | Resolution vs. cost trade-off |
| Zone delineation | K-means clustering on soil/NDVI layers | Number of zones affects applicator complexity |
| Prescription generation | Agronomic model + field calibration | Model must be calibrated to local conditions |
| File transfer to machine | ISO XML / ISOBUS TaskData | Compatibility with terminal firmware version |
| As-applied logging | Machine telemetry export | Needed to close the loop on actual vs. prescribed |
The failure point is usually step 4. ISOBUS compatibility in practice is messier than the standard implies. Always test prescription files against the specific terminal firmware version before assuming they will load correctly.
Building vs. Buying: Where Does Custom Development Make Sense?
Off-the-shelf platforms (Climate FieldView, Trimble Ag Software, SST Summit) cover most of the standard workflow. They are well-integrated with major equipment brands and agronomically sound. If your use case fits their model, use them.
Custom development makes sense in four situations:
- You are processing imagery or telemetry at a scale or frequency the platforms do not support.
- You need to integrate a non-standard sensor type or data source, for example, IoT water quality sensors in irrigated rice systems.
- You are building a marketplace or advisory service on top of the data, where the platform's data model is the product.
- You are operating in a geography or crop type that the major platforms treat as secondary.
In these cases, a typical stack looks like: PostgreSQL with PostGIS for spatial data, GDAL for raster processing, a Python-based inference layer (PyTorch or scikit-learn depending on the model type), and a tile server like Titiler for serving processed imagery to field-facing apps.
Conclusion
Precision agriculture works when the data loop is genuinely closed: sensing, inference, physical action, and measurement of outcomes. Most implementations stall at the integration layer, either because data from different sources is never reconciled, or because prescription outputs are generated but never validated against what actually happened in the field.
If you are scoping a precision agriculture system, start with the as-applied logging requirement and work backwards. If you cannot capture what was actually done, you cannot improve the next recommendation. Everything else builds on that audit trail.
If you are evaluating whether to build a custom platform or integrate with an existing one, map your data sources first. If more than two of your key inputs fall outside what standard ADAPT-compatible platforms support, a custom data layer is likely worth the investment. We are happy to work through that scoping with you.
FAQ
What is the minimum sensor density needed for meaningful variable rate prescriptions? It depends on field variability. A standard starting point is one composite soil sample per 2.5 hectares for nutrient prescriptions. For water management, EC mapping at one reading per 0.1 hectares gives you enough resolution to delineate management zones. Denser sampling adds cost with diminishing returns on uniform soils.
Can satellite imagery replace on-the-ground scouting? Not fully. Sentinel-2's 10 m resolution and 5-day revisit cycle is useful for tracking seasonal trends and flagging stress zones. It cannot reliably detect early-stage disease, pest pressure at ground level, or localised damage below its spatial resolution. Imagery narrows where to look; a scout confirms what to do.
How do you handle connectivity in fields with no cellular coverage? LoRaWAN is the standard for low-bandwidth sensor data. Gateways can store data locally and sync when connectivity is available. For imagery and large file transfers, the practical answer is still store-and-forward: collect locally, upload at the farm office or nearest connected point. Starlink is changing this in some geographies but coverage is still inconsistent in dense agricultural regions.
What agronomic models are commonly used for yield prediction? DSSAT and APSIM are the two most widely used process-based crop simulation models. Both are open-source and well-validated across major crops. They require calibrated soil profiles and local weather data to perform well. ML models trained on historical yield data can complement them but rarely outperform them on out-of-sample years with unusual weather.
Is farm data subject to GDPR? If the data can be linked to an identifiable natural person, such as a sole-trader farmer, then yes, GDPR applies. Anonymised, aggregated field data that cannot be re-linked to an individual generally falls outside GDPR scope. The EU Data Act additionally creates obligations around data sharing for connected devices, including agricultural machinery, effective from September 2025.
Have a project in mind? Contact Sodio Technologies to discuss your requirements and explore the right technology solution for your business.
/// Work with us
Talk to the engineers who'd build it
You'll get a technical scope, timeline and cost estimate from the people doing the work, not an account manager. In-house team, no subcontracting, since 2016.