

Water Management Systems: Ensuring Efficient Use of Water
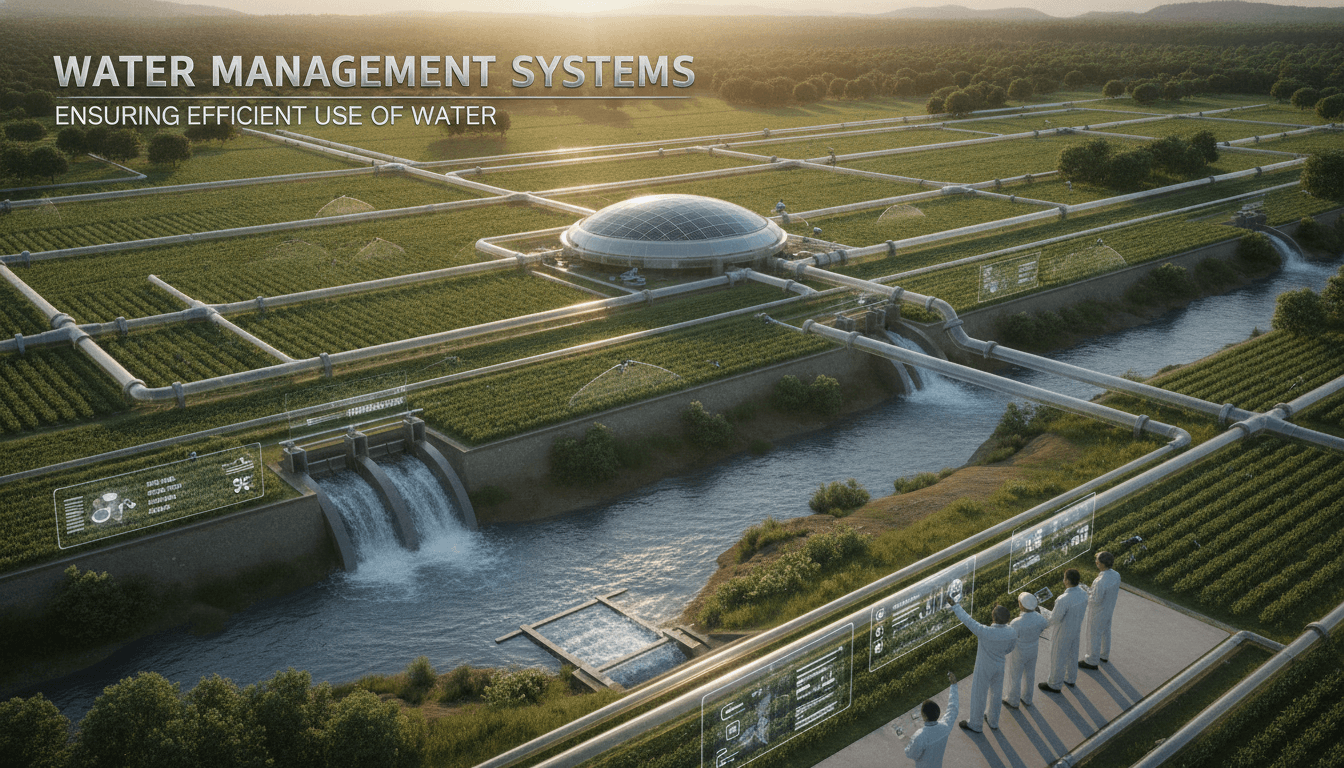
Water scarcity is not a future problem. Right now, 2.2 billion people lack access to safely managed drinking water, and agriculture accounts for roughly 70% of all global freshwater withdrawals. The engineering response to this has matured significantly over the past decade, moving from basic SCADA systems to distributed, sensor-heavy networks with real-time analytics. This post breaks down how modern water management systems are built, where the hard problems actually sit, and what trade-offs you'll face when architecting one.
How Does a Water Management System Actually Work?
At its core, a water management system is a data pipeline with physical actuators at both ends. Sensors measure flow rate, pressure, turbidity, pH, dissolved oxygen, and conductivity across intake points, distribution networks, and discharge outlets. That data moves through a communication layer (typically LoRaWAN, NB-IoT, or 4G depending on geography and power availability) into a central processing layer, which triggers decisions: open a valve, flag an anomaly, reroute flow.
The physical instrumentation matters a lot. Electromagnetic flow meters (such as Siemens SITRANS F M) are the standard for clean water; ultrasonic meters are preferred for non-invasive retrofits on existing pipes. Pressure transducers like the Yokogawa EJX series are common in treatment plants. Getting calibration wrong at this layer corrupts everything downstream.
The Communication Layer
LoRaWAN is the most common choice for wide-area water networks because it reaches 5–15 km in rural conditions on a single gateway, with nodes running on battery for 5–10 years. The trade-off is bandwidth: you get kilobits per second, not megabits. For high-frequency sampling (sub-second readings on a turbine meter, for instance), you need a wired MODBUS or industrial Ethernet backbone instead.
NB-IoT is a good middle ground in urban deployments where cellular coverage is reliable and you want bidirectional control without running your own gateway infrastructure. Latency is higher than LoRaWAN for uplinks but response times for downlinks are more predictable.
What Are the Real Engineering Challenges in Smart Water Networks?
Sensor drift and data quality are the unglamorous bottleneck. A pressure sensor that drifts 0.5% per month sounds trivial until you're using that data to detect 2% non-revenue water losses. Most production systems need automated drift detection, either through cross-validation with neighbouring sensors or scheduled recalibration cycles tied to maintenance schedules.
Intermittent connectivity is the other persistent issue. A node going offline for six hours is not unusual in a rural network. You need edge buffering (most modern RTUs handle this) and your ingestion layer must handle out-of-order time-series data correctly. InfluxDB and TimescaleDB both handle this reasonably well; raw PostgreSQL does not.
Leak Detection
Statistical methods have largely replaced simple threshold alerts for leak detection. Minimum Night Flow (MNF) analysis is the standard first pass: you measure flow at 2–4 AM when consumption is lowest, and any baseline above expected leakage rates flags a problem zone. Paired with pressure zone modelling, this narrows the fault to a district metered area (DMA) before you send anyone in the field.
ML-based approaches (LSTM models trained on historical flow patterns, for example) have shown 15–20% improvement in early detection rates in published trials, but they need 12–18 months of clean training data before they outperform MNF. Do not build an ML pipeline on six months of sensor data; it will underperform a well-tuned rule set.
/// Not sure where to start?
Get the architecture before you commit
Tell us what you're building and we'll map the technical approach, stack, and rough timeline. No cost, no obligation, no sales call required.
Irrigation and Agricultural Water Management
Agricultural systems have different constraints from municipal ones. The primary objective is evapotranspiration (ET) modelling: calculating how much water the crop is losing to atmosphere so you can replace exactly that amount, no more. FAO-56 is the reference standard for ET calculation. Modern systems pull weather data from on-site stations or APIs like OpenWeatherMap and combine it with soil moisture readings (capacitance probes at multiple depths) to schedule irrigation automatically.
Drip irrigation controlled by a soil-moisture feedback loop typically reduces water consumption by 30–50% compared to schedule-based surface irrigation. The hardware cost is real, and the ROI depends heavily on crop type and water tariff. For row crops at current tariffs in most Indian states, payback periods run 3–5 years. For high-value horticulture, it is often under 18 months.
The software stack here is simpler than a municipal network. A Raspberry Pi 4 with a relay board, a soil moisture sensor array (Decagon 5TM or equivalent), and a Python scheduling daemon can run a small farm's irrigation without cloud dependency. Scale that up and you need proper SCADA with redundancy, but do not over-engineer the entry point.
Building vs Buying: Where the Trade-offs Actually Land
| Criteria | Off-the-shelf SCADA (e.g. AVEVA, Wonderware) | Custom build |
|---|---|---|
| Time to first deployment | 4–8 weeks | 4–6 months |
| Integration with legacy PLCs | Good (standard OPC-UA support) | Varies by protocol |
| Unit cost at scale | Licensing grows with data points | Fixed infra cost |
| Ability to add custom analytics | Limited without vendor add-ons | Full control |
| Maintenance burden | On vendor | On your team |
For most utilities with standard infrastructure, AVEVA or a similar SCADA platform gets you to production faster. The case for a custom system is strong when you have non-standard sensor networks, need to integrate with third-party billing or GIS systems, or have analytics requirements the platform vendors won't support without expensive add-ons.
One point that often gets missed: SCADA licensing models typically charge per data point or per connected device. At 10,000 sensors, that cost is non-trivial. Run the five-year total cost of ownership calculation before you decide.
Regulatory and Data Considerations
Water quality data is increasingly subject to regulatory reporting requirements. In India, the Central Pollution Control Board mandates online continuous monitoring for effluent discharge above certain thresholds. In the EU, the Water Framework Directive (2000/60/EC) and the Drinking Water Directive (2020/2184) set strict reporting cadences.
Your data architecture needs to account for this from the start. Audit logs, tamper-evident storage, and the ability to generate certified reports are not features you can bolt on later. Immutable time-series storage (writing to WORM-compliant object storage like AWS S3 with Object Lock) is one practical pattern. Blockchain-based audit trails are an option but add operational complexity that is rarely justified for regulatory reporting alone.
Conclusion
If you are scoping a water management system, start with the sensor layer and the communication topology before you think about software. Bad data arriving reliably is easier to fix than good data arriving intermittently. Nail your DMA boundaries, validate your flow meters, and choose your communication protocol based on your actual geography, not what a vendor has pre-packaged.
The next concrete step: map your network into district metered areas, instrument the boundary points first, and run MNF analysis for 90 days before building any ML on top of it. That baseline will tell you more than any model trained on shorter data.
FAQ
What communication protocol should I use for rural water sensor networks? LoRaWAN is the default for rural deployments with wide area coverage and low power budgets. It covers 5–15 km per gateway and supports node battery life of 5–10 years. If you need bidirectional control with predictable latency and cellular coverage is reliable, NB-IoT is a practical alternative.
How accurate is ML-based leak detection compared to traditional methods? Published results show LSTM-based models improving early detection rates by 15–20% over Minimum Night Flow analysis, but only after 12–18 months of clean training data. Before that threshold, a well-configured MNF rule set will typically outperform an ML model. Start with MNF and layer ML in once you have sufficient history.
What database should I use for water sensor time-series data? TimescaleDB and InfluxDB are both solid choices. TimescaleDB has the advantage of being PostgreSQL-compatible, which simplifies integration with reporting tools. InfluxDB has a more purpose-built query language for time-series. Avoid standard relational databases for high-frequency sensor ingestion; the write performance does not hold at scale.
When does it make sense to build a custom water management system rather than use an off-the-shelf SCADA platform? The main trigger is scale-based licensing cost (SCADA platforms charge per data point), non-standard sensor networks, or advanced analytics requirements. If you have standard PLC infrastructure and fewer than a few thousand data points, commercial SCADA will get you to production faster and at lower total cost.
How does irrigation scheduling software calculate how much water to apply? Most systems implement the FAO-56 Penman-Monteith method for reference evapotranspiration, then apply a crop coefficient for the specific plant type and growth stage. Soil moisture sensors at root depth provide a feedback signal to validate the model output and prevent over-irrigation when soil is already at field capacity.
Have a project in mind? Contact Sodio Technologies to discuss your requirements and explore the right technology solution for your business.
/// Work with us
Talk to the engineers who'd build it
You'll get a technical scope, timeline and cost estimate from the people doing the work, not an account manager. In-house team, no subcontracting, since 2016.