

 /// TELECOM · ANALYTICS
Telecom Data Analytics
One analytics layer across network, usage, billing and customer data — the KPIs operators, ISPs and MVNOs run on, defined once and trusted by every team.
 Message on WhatsApp

TRUSTED BY TEAMS


Operators collect more data than almost any other business and use surprisingly little of it. Network counters sit in operations systems, usage records in mediation, bills in billing, and customers in the CRM — each with its own definitions.
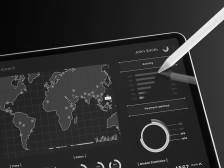
Sodio builds telecom analytics for operators, ISPs and MVNOs that joins them into one foundation: a single view of each subscriber, service and network element, and metrics such as churn, ARPU and active subscribers defined once and used everywhere.
/// IS CUSTOM RIGHT FOR YOU?
When a Cloud Data Warehouse and a BI Tool Are Enough
Much of telecom analytics can be done with standard tools: a cloud data warehouse, a BI tool, and the reports your operations and billing systems already produce. If your data is in a handful of systems and everyone agrees on the numbers, you may only need them set up well.
Standard tools are enough when
- Data lives in a few systems with clean exports
- Everyone agrees on how each metric is counted
- Data volumes fit comfortably in a standard BI setup
- Reporting is the goal
A telecom data platform is worth building when
- Data is spread across network, usage, billing, CRM and partner systems
- Teams report different numbers for the same thing
- Usage records run to billions a day
- Churn, fraud and network models need a shared foundation
/// USE CASES
Telecom Analytics Use Cases

Churn and retention

Fraud

Revenue assurance

Capacity planning

Network anomalies

Customer experience

Product and ARPU performance

Marketing and segmentation

Roaming and interconnect

Network analytics

///THE PLATFORM
The Data Platform Underneath

Data ingestion at scale
Usage records, network counters and business data brought in continuously, including billions of records a day.

Unified data model
Subscribers, services, network elements and accounts linked, so one customer is the same customer in every report.

One definition per metric
Active subscribers, churn, ARPU and network KPIs each defined once and used everywhere.

Dashboards
Executive, commercial and network views built from the same underlying data.

Self-service analysis
Analysts query the data directly in the BI tools they already use.

Real-time streams
Events available within seconds for fraud, network and customer experience use cases.

Data quality checks
Missing files, late feeds and figures that do not reconcile flagged before anyone relies on them.

Privacy controls
Subscriber data masked and access restricted by role, following CPNI and GDPR.
Usage records, network counters and business data brought in continuously, including billions of records a day.
Subscribers, services, network elements and accounts linked, so one customer is the same customer in every report.
Active subscribers, churn, ARPU and network KPIs each defined once and used everywhere.
Executive, commercial and network views built from the same underlying data.
Analysts query the data directly in the BI tools they already use.
Events available within seconds for fraud, network and customer experience use cases.
Missing files, late feeds and figures that do not reconcile flagged before anyone relies on them.
Subscriber data masked and access restricted by role, following CPNI and GDPR.
/// FROM RAW DATA TO ACTION
From Raw Data to Decisions Everyone Trusts
Data arrives from every system
Usage records, network counters, billing and CRM data ingested continuously
Errors and gaps are handled
Duplicates removed, late feeds flagged, formats standardised
Records are joined up
Subscribers, services and network elements linked across systems
Metrics are agreed
Each KPI calculated once, by one agreed definition
Teams use the data
Dashboards, analysis and models built on the same foundation
Insight becomes action
Alerts, campaigns, fixes and investments driven from the results
/// THE DATA SOURCES
Where Telecom Data Lives
///AI IN TELECOM ANALYTICS
Where AI Fits on Top
Every AI use case in telecom depends on the same thing: data that is joined up, clean and consistently defined. Build that once, and each model after it is faster and cheaper.

Prediction
Churn, fraud and capacity models trained on the shared foundation rather than on separate data extracts.

KPI alerts
Unusual movements in key metrics — a sudden drop in top-ups, a rise in complaints — flagged the day they happen.

Questions in plain language
Managers ask questions of the data in everyday language and get answers from the agreed definitions, with the query shown.
Churn, fraud and capacity models trained on the shared foundation rather than on separate data extracts.
Unusual movements in key metrics — a sudden drop in top-ups, a rise in complaints — flagged the day they happen.
Managers ask questions of the data in everyday language and get answers from the agreed definitions, with the query shown.
/// COMPARE
Existing Reports, Vendor Analytics or Custom Telecom Analytics Solutions
/// COST AND TIMELINE
What Drives the Cost and Timeline
A first set of dashboards on joined-up data, with agreed definitions for the key metrics, typically arrives within 30 days. A production data platform follows within 90.
The cost moves with six things: data volumes; how many source systems are involved; whether real-time streams are needed; the work of agreeing metric definitions across teams; privacy controls; and the ongoing cost of storage and queries at telecom scale.
/// FAQ
Frequently Asked Questions
Data analytics in the telecom industry means bringing together network, usage, billing and customer data to understand and improve the business — who is using what, where the network is struggling, which customers are at risk, where revenue is leaking, and where to invest. The hard part is rarely the analysis; it is joining data from systems that were never designed to work together.
Churn prediction, fraud detection, revenue assurance, network capacity planning, anomaly detection, customer experience measurement, product and ARPU analysis, marketing segmentation, and roaming and interconnect analysis. Most operators start with one or two of these and build the shared data foundation as they go.
Usually because they define the same metric differently. Finance, marketing and the network team may each count "active subscribers" in their own way — by thirty days of activity, ninety days, or any top-up at all — and all be right by their own rules. A single definition layer settles that once, so every report uses the same figure.
Yes. Big data analytics in telecom is a question of architecture: usage records are loaded into warehouse or lakehouse platforms built for that volume, with streaming for the cases that need seconds rather than hours. Storage and query costs are designed for from the start, because at telecom volumes they grow quickly.
Subscriber data is masked wherever the analysis does not need it, access is limited by role, and every query is logged. Telecom customer data carries specific rules — CPNI in the US and GDPR in the UK and EU — and location data in particular is only used in aggregated or properly consented form.
No. Power BI, Tableau or whatever your analysts already use stays. The data platform feeds it with clean, joined-up data and agreed definitions, so the dashboards people already know start showing numbers everyone trusts.
/// RELATED SERVICES
Related Industries and Services
Routes where scope overlaps with telecom data analytics.
/// GET STARTED
Start With the Number Your Teams Disagree On
Tell us which metric gets reported differently by different teams, and which systems it comes from. We will prepare a free solution architecture for a data foundation that settles it — and the analytics you could build on top.